Overview
e-TSN is an interactive visualization platform for discovering potential associations between human diseases and targets.
The significance (the relative strength of the association between a target and a disease) and novelty (the potential and value of the given entity) of targets are the two most important points in target discovery. We used natural language processing to extract the relationships between targets and diseases from a large number of published biomedical literatures. We then established a significance and novelty evaluation method based on the principle of statistics.Using these data, we built this web tool, which enables users to explore the relationships between the novelty of potential drug targets and their significance to diseases.
The basic idea of designing the significance and novelty of targets was guided by the following assumptions:
(1) A target or disease that is mentioned in fewer literature collection is more novel and less well understood.
(2) If there is a disease and target entity in the literature sentence at the same time, and there is a connective word indicating their relationship, it can be considered that there is a relationship between the two entities.
(3) If the distance between the two entities is less than a specific threshold, it can be considered that the relationship between them is relatively strong.
Statistics
Target Statistics
| DTO Family
| Target Count |
| Enzyme |
4146 |
| Epigenetic |
242 |
| GPCR |
408 |
| oGPCR |
421 |
| Ion channel |
344 |
| Kinase |
634 |
| Nuclear Receptor |
48 |
| Transcription Factor |
1438 |
| Transporter |
473 |
| Non-IDG |
12103 |
| TDL Family |
Count |
| Tclin |
612 |
| Tchem |
1389 |
| Tbio |
11651 |
| Tdark |
6605 |
Disease Statistics
| DO Family |
Count |
| disease of anatomical entity |
4687 |
| disease of cellular proliferation |
2539 |
| disease of metabolism |
465 |
| disease of mental health |
330 |
| disease by infectious agent |
366 |
| genetic disease |
499 |
| physical disorder |
71 |
| syndrome |
138 |
| rare disease |
7948 |
Web interface and use cases
Searching by disease name and by target name (with auto-suggest) is supported. Users can obtain the significance and novelty distribution of all related targets by retrieving the disease of interest keywords. For instance, targets which associates with the selected disease "SARS-CoV-2 infection" are plotted in a scatter plot with log–log Significance–Novelty axes as Figure 1 shows. In the scatter layout, the targets on the right side of the plot may have a stronger correlation with the given disease, while the targets in the upper part of the plot may not have been widely studied. In general, the more interesting associations will appear in the upper-right corner of the plot and could be given top priority when choosing candidates, which can accelerate target discovery by assisting identify and prioritize under-researched genes or proteins as potentially novel drug targets for further research. Targets can be filtered based on protein family (e.g. GPCRs) and Target Development Level (TDL) such as Tclin, Tchem, Tbio, and Tdark. More information about target development levels can be found at http://www.nature.com/nrd/posters/druggablegenome/. Besides, we provided detailed annotation information including approved drugs and associated bioactivities for each association when click in order to facilitate adequate consideration of multiple targets for drug development. Hyperlink points outs to Pharos, Uniprot, gene, ChEMBL and Disease Ontology are provided. Figure 2 illustrates the result of mouse click actions for the target ‘Angiotensin-converting enzyme 2’ from Figure 1.
In addition, users can also explore the significance and novelty distribution of the diseases related to the specific target (Figure 3), which can assist researchers quickly grasp which diseases are associated with the target of interest, and carry out research on more novel disease fields in order to find new indications for drug repurposing.

Figure1. The figure shows how the disease–target associations are presented in the scatter plot, exemplified by the "SARS-CoV-2 infection" disease.
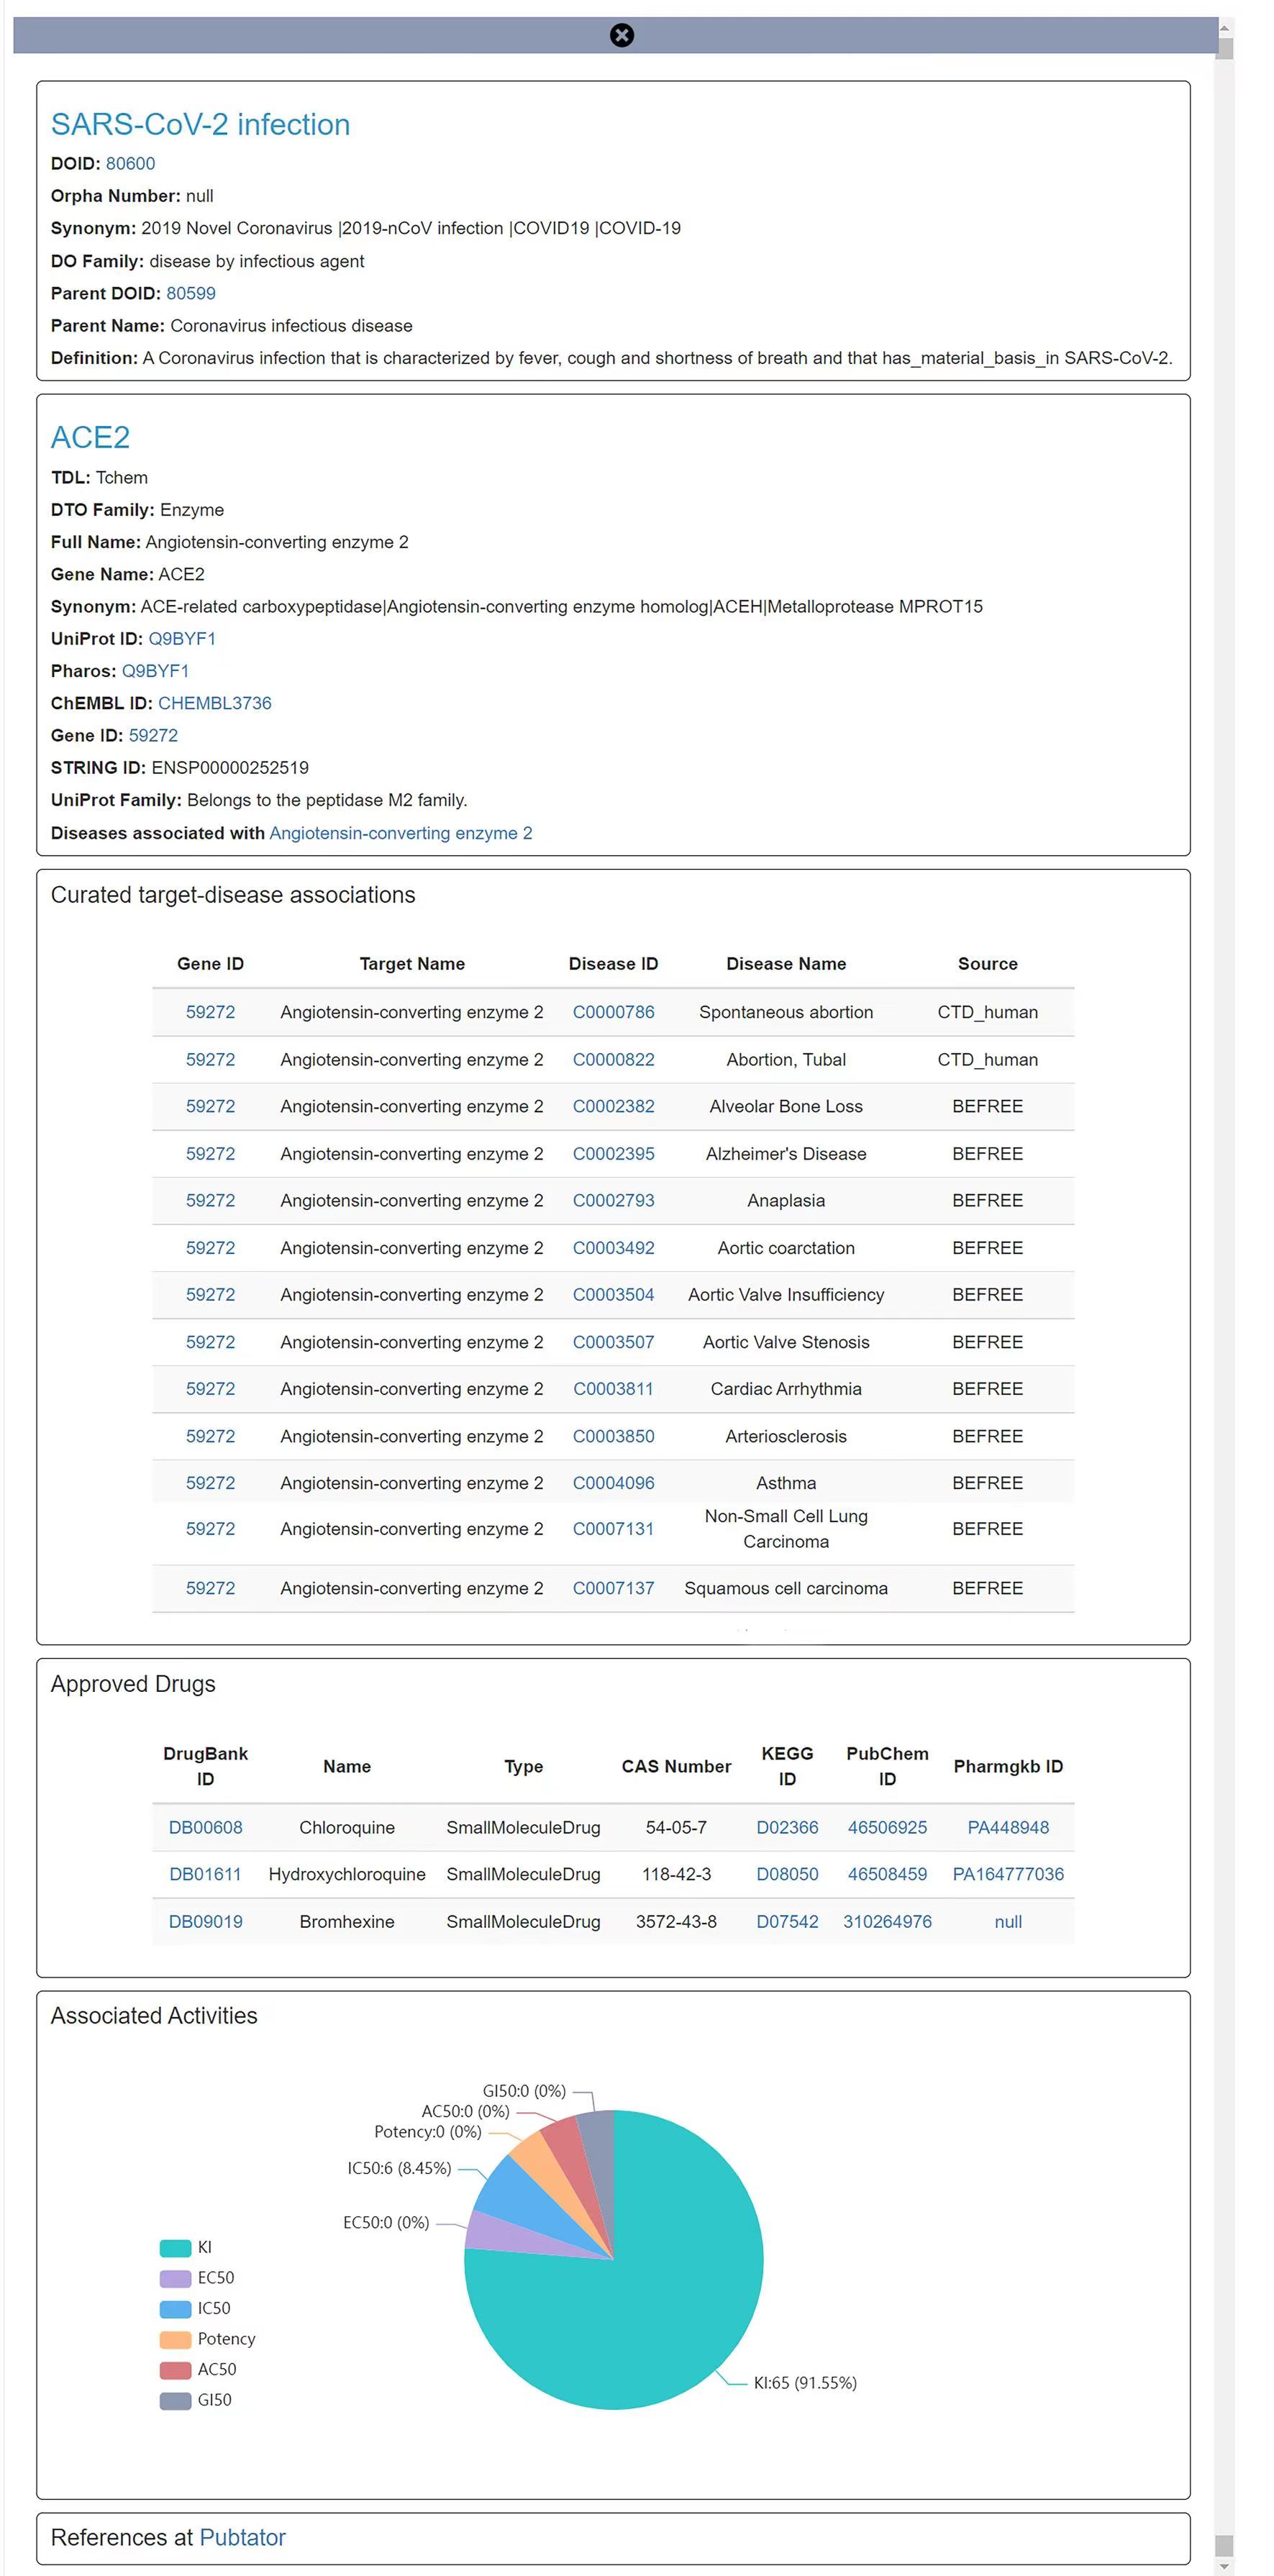
Figure2. Click on selected point shows more details of target and disease, exemplified by the " Angiotensin-converting enzyme 2" target.

Figure3. The figure shows how the disease–target associations are presented in the scatter plot, exemplified by the "Angiotensin-converting enzyme 2" target.
Publications
Ziyan Feng, Zihao Shen, Honglin Li and Shiliang Li. e-TSN: an interactive visual exploration platform for target–disease knowledge mapping from literature. Briefings in Bioinformatics. 2022; bbac465.https://doi.org/10.1093/bib/bbac465
Contact Us
We have a dedicated email address for data queries, error reporting or help requests. This is: lilab_ecust@163.com